

On this page
- Key Takeaways
- What Is the Operational Difference Between Agent Utilization and Occupancy Rate?
- How Does Productive Shrinkage Distort BPO Commercial Models?
- Why Is Schedule Adherence Critical for Eliminating Overstaffing Overhead?
- How Does Effective Hourly Yield Uncover True Fully Loaded Delivery Costs?
- What Does Restructuring Delivery Metrics Look Like in Practice?
- How Does PITON-Global Optimize Vendor Selection and Metrics Governance?
- Frequently Asked Questions
CFOs evaluating offshore BPO partnerships in the Philippines must look beyond superficial billable hours to track four core workforce utilization metrics: Occupancy Rate, Productive Shrinkage Ratio, Schedule Adherence, and Effective Hourly Yield. Measuring them against local operational baselines prevents unbilled margin erosion, eliminates concealed capacity loss, and guarantees long-term delivery quality. They are one layer of measuring and governing an outsourced contact center, and the layer vendors most often blur.
Key Takeaways
- Occupancy vs. utilization: Distinguish total logged-in agent time from active handling time to avoid misreading inflated vendor performance reports.
- Granular shrinkage isolation and micro-interval adherence: Separate controllable internal shrinkage (coaching, unscheduled absenteeism) from statutory Philippine leave entitlements, and track schedule adherence down to 15-minute intervals to eliminate overstaffing buffers driven by coverage gaps.
- Effective Hourly Yield (EHY): Calculate fully loaded total operational spend divided by verified productive transaction hours rather than relying on contracted baseline rates.
- Turnover-adjusted productivity: Quantify the continuous capacity drag caused by agent ramp-up learning curves and ongoing onboarding overhead.
What Is the Operational Difference Between Agent Utilization and Occupancy Rate?
Agent utilization is the percentage of paid shift hours an agent is logged in—including calls, administrative hold, queue waiting, and internal chat—while occupancy is the percentage of logged-in time spent actively handling transactions. A provider reporting very high utilization alongside low occupancy is structurally overstaffed; optimal Philippine occupancy sits in a balanced middle band, and forcing it toward the ceiling triggers burnout and attrition.
While many offshore service providers report very high overall utilization rates to signal maximum productivity, CFOs must separate total agent utilization from actual operational occupancy. High utilization frequently masks workflow friction, software latency, and unbilled standby intervals.
Agent Utilization Rate
The percentage of paid shift hours during which an agent is logged into the system—including active calls, administrative hold time, queue waiting, and internal chat navigation. It measures presence, not output, so read it alongside the broader set of outsourcing KPIs rather than on its own.
Occupancy Rate
The precise percentage of logged-in time agents spend actively processing transactions, handling live customer interactions, or executing direct back-office tasks: occupancy equals active handling time divided by total logged-in time, multiplied by 100. A service provider reporting near-total utilization with low occupancy indicates structural overstaffing or inefficient work distribution. Across Philippine contact centers and shared service centers, optimal occupancy targets sit in a balanced band below the maximum; consistently forcing occupancy toward the ceiling triggers systemic agent burnout and voluntary attrition, driving up long-term recruitment and retraining expense. The shift map below shows where an eight-hour paid day actually goes.
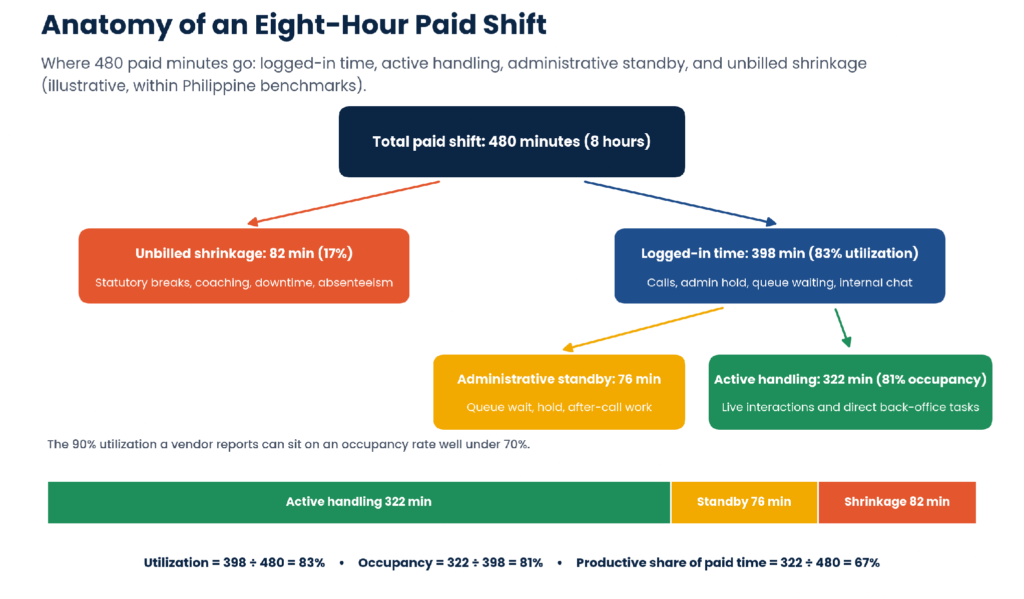
Figure 1. Anatomy of an eight-hour paid shift: logged-in time, active handling time, administrative standby, and unbilled shrinkage (illustrative).
The four metrics below—occupancy, productive shrinkage, schedule adherence, and Effective Hourly Yield—together give the CFO a complete picture of where paid time goes and what each productive hour actually costs. They complement the unit-cost and governance metrics CFOs track on the invoice side.
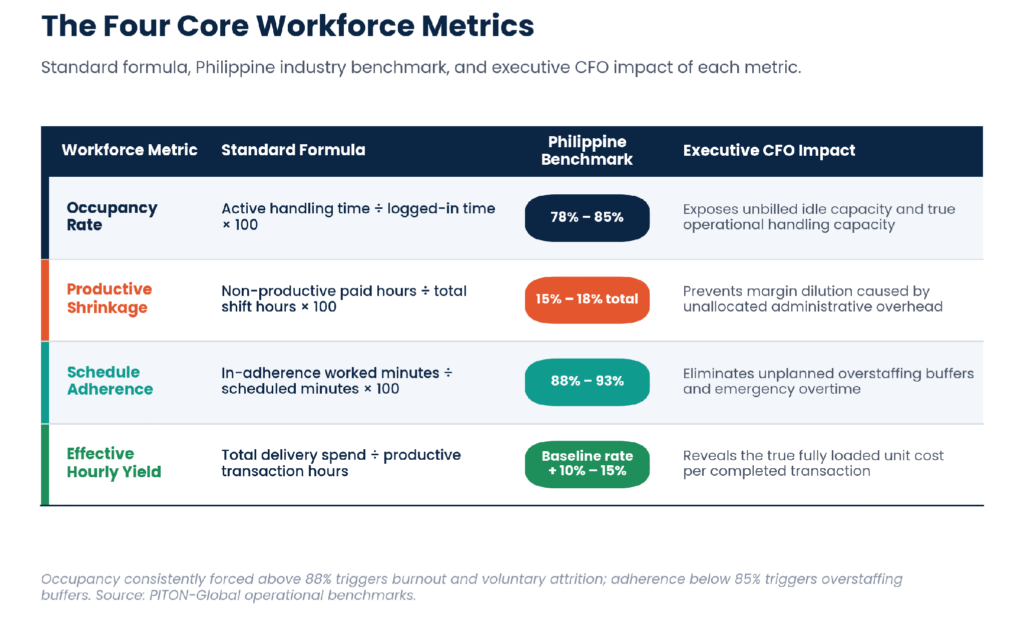
Figure 2. The four core workforce metrics: standard formula, Philippine industry benchmark, and executive CFO impact.
How Does Productive Shrinkage Distort BPO Commercial Models?
Productive shrinkage is paid work time lost to non-handling activities—team huddles, statutory breaks, client-mandated retraining, system downtime, and unscheduled absenteeism—and consumes a significant share of paid time across Philippine delivery hubs. When vendors bundle it into one overhead line, non-productive time is passed to the buyer through inflated base rates, so CFOs must require statutory shrinkage to be separated from controllable internal shrinkage.
Productive shrinkage reflects total paid work time lost to non-handling activities, including team huddles, statutory breaks, client-mandated retraining, system downtime, and unscheduled absenteeism. In Philippine delivery operations, failing to categorize shrinkage components distorts financial modeling and unit-cost forecasting.
Total shrinkage takes a significant, recurring share of paid time across Philippine delivery hubs. CFOs must require vendors to separate statutory local shrinkage—13th-month pay adjustments, holiday differentials, and mandated wellness leave—from controllable internal shrinkage such as coaching, team meetings, and software troubleshooting. When providers bundle shrinkage into a single overhead line item, non-productive time is routinely passed to the buyer through inflated base hourly rates. The breakdown below shows a typical composition and how much of it the provider actually controls.
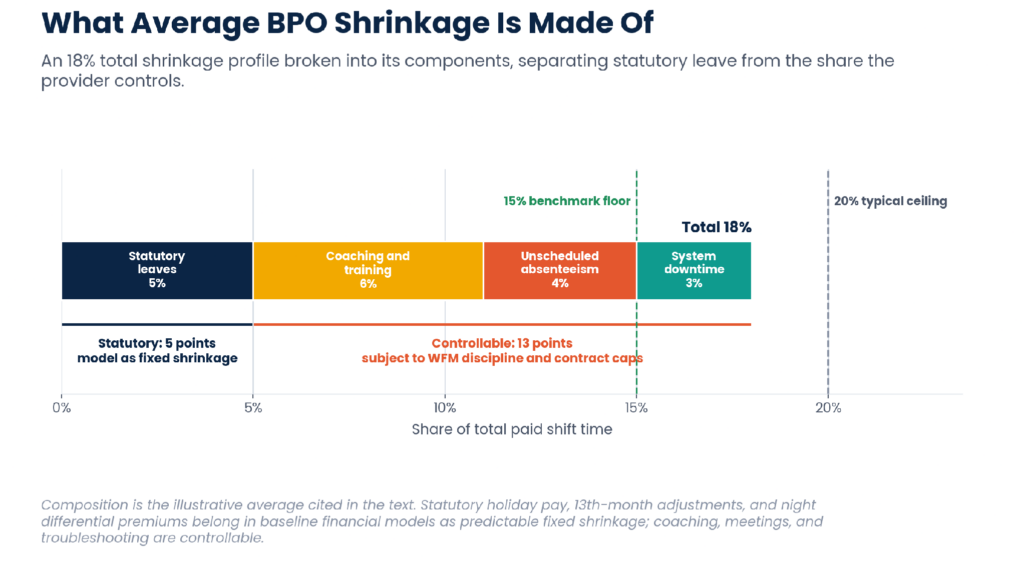
Figure 3. Average BPO shrinkage broken down into statutory leave, system downtime, coaching and training, and unscheduled absenteeism, with the controllable share identified.
The true measure of offshore cost optimization isn’t labor arbitrage—it’s execution accuracy, retention, and long-term productive yield. When CFOs focus exclusively on initial hourly bill rates rather than productive yield, they absorb massive hidden friction costs from churn and unmanaged shrinkage.
— John Maczynski, CEO, PITON-Global
Why Is Schedule Adherence Critical for Eliminating Overstaffing Overhead?
Schedule adherence measures whether personnel are performing scheduled tasks at the exact intervals planned: minutes worked in the assigned activity divided by scheduled activity minutes. When adherence slips, operations managers add staffing buffers to cover queue shortfalls, and in multi-channel operations serving North American or European time zones slippages compound into coverage gaps, overtime distortions, and capacity waste.
Tracking adherence down to 15-minute intervals is what makes the metric actionable. Well-run Philippine operations hold adherence high; once it slips, the buffers that managers add to protect service levels become a permanent, unbilled cost that surfaces in three ways.
Concurrence Gaps
Misaligned shift arrivals create coverage shortfalls during volume surges, delaying transaction processing and missing SLAs. In time-zone-offset operations the surge windows are narrow, so a ten-minute drift across a team is a queue that never recovers.
Overtime Distortions
Uncontrolled schedule drift increases reliance on night-differential overtime pay, inflating monthly operational bills. The overtime is real cost incurred to cover hours that were already paid for once.
Capacity Waste
Unscheduled agent idle time during low-volume intervals inflates the net unit cost per completed task. Adherence failures therefore cut both ways: too few agents at the peak and too many in the trough.
How Does Effective Hourly Yield Uncover True Fully Loaded Delivery Costs?
Effective Hourly Yield measures the actual cost per productive hour: total invoiced contract costs plus direct tooling overhead, divided by verified productive transaction hours. If an enterprise pays a fixed contracted hourly rate but shrinkage and ramp-up inefficiency reduce active handling output by a fifth, EHY rises a quarter above that rate per productive hour; at well-run providers the gap stays modest.
Relying solely on contracted hourly bill rates gives CFOs an incomplete picture of outsourcing expenditure. Effective Hourly Yield combines base billing, hardware and licensing fees, management overhead, and paid non-productive shrinkage into a single cost per productive hour delivered, which is the only figure that can be compared across candidate vendors.
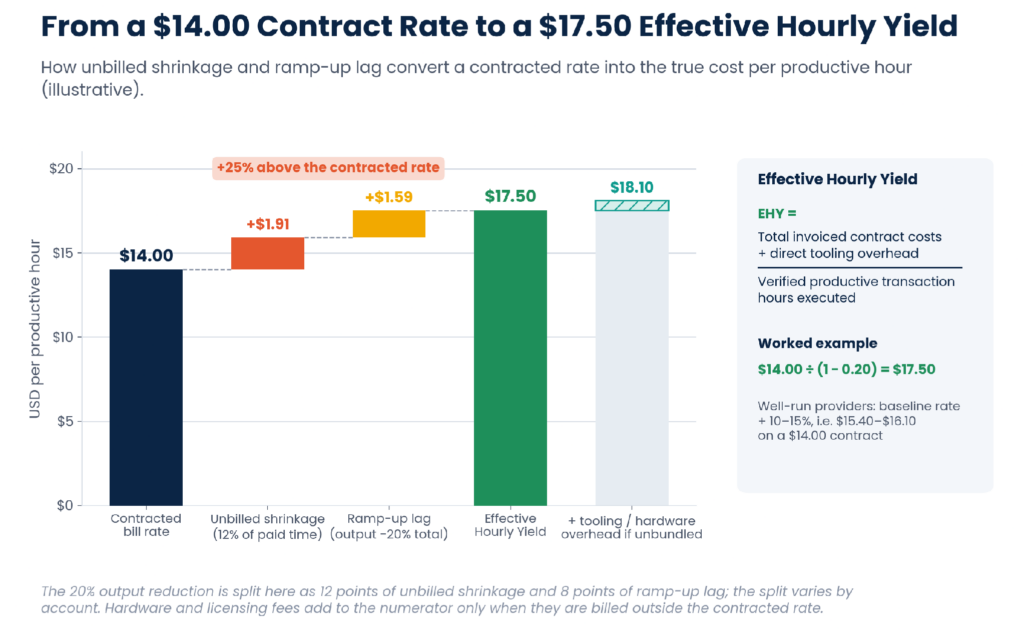
Figure 4. From contract rate to Effective Hourly Yield: the cost add-ons of unbilled shrinkage and ramp lag, with tooling overhead where it is billed separately (illustrative).
Evaluating EHY across candidate vendors prevents surprise invoice overruns and ensures accurate budget forecasting. A provider with a slightly higher rate but a smaller output loss can deliver a lower EHY than a cheaper provider with heavier losses—a comparison the rate card alone will never reveal.
What Does Restructuring Delivery Metrics Look Like in Practice?
Restructuring delivery metrics means moving to a partner that can measure them. A North American healthcare administrator with heavy unmanaged shrinkage and poor adherence at a legacy vendor migrated to a WFM-enabled provider with real-time desktop tracking, interval adherence alerts, and granular shrinkage reporting, reaching healthy average occupancy, a much smaller controllable shrinkage share, and markedly lower net transaction costs within six months.
Client Challenge
A North American healthcare administrator experienced rising transaction costs and fluctuating queue turnaround times with a legacy offshore vendor, driven by heavy unmanaged shrinkage and poor schedule adherence that the vendor’s bundled reporting could neither isolate nor explain.
Vendor Selection
PITON-Global audited the client’s operational workflows and evaluated prospective partners from its Philippine network, filtering specifically for providers with automated WFM systems and specialized healthcare experience.
Solution Implemented
The program was migrated to a recommended delivery partner utilizing real-time desktop activity tracking, automated interval adherence alerts, and granular shrinkage reporting, with controllable shrinkage and micro-interval adherence written into the performance-based SLAs.
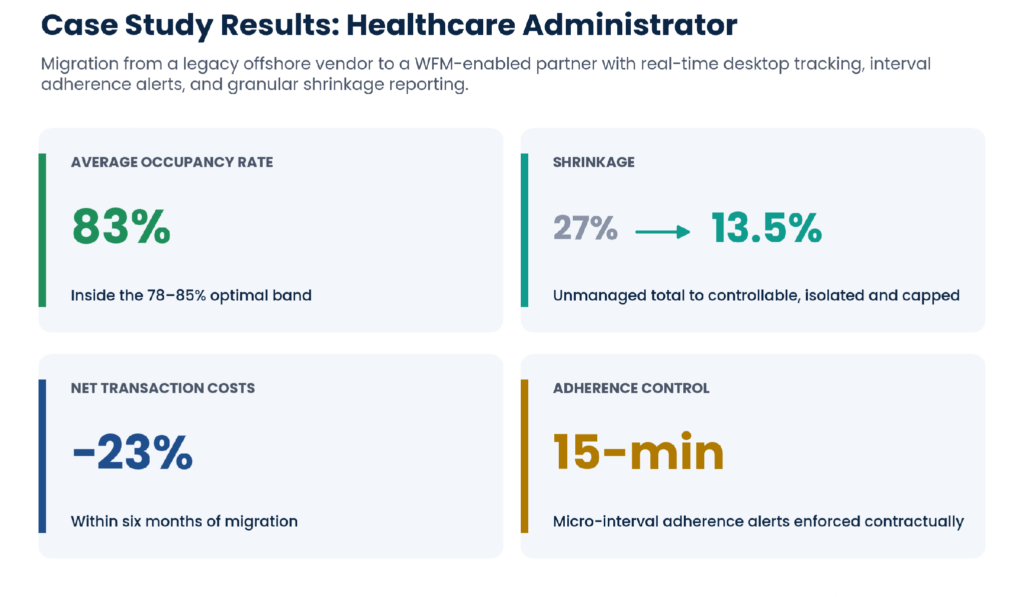
Figure 5. Quantifiable outcomes of the healthcare administrator’s delivery-metrics restructuring.
Outcomes and Lessons
The client achieved a healthy average occupancy rate, cut controllable shrinkage substantially, and lowered net transaction costs markedly within six months. The lesson: contractually enforcing micro-interval adherence metrics and isolating controllable shrinkage components during initial vendor selection protects operating margins and maintains service quality.
How Does PITON-Global Optimize Vendor Selection and Metrics Governance?
PITON-Global is a specialized BPO advisory and management consultancy that guides enterprise executives through partner selection in the Philippines. Unlike traditional matchmaking brokers, it evaluates candidate providers with proprietary operational benchmarks and real-time performance auditing across a network of more than 100 vetted partners, helping organizations structure performance-based SLAs, eliminate sourcing risk, and maximize long-term productive yield.
Who Is PITON-Global?
PITON-Global is a specialized, vendor-neutral BPO advisory and management consultancy headquartered in Manila, led by senior operators with more than 65 combined years of global outsourcing governance. Selecting an offshore partner requires auditing workforce management architectures, local labor governance structures, and historical delivery productivity, and that operational audit is the firm’s core discipline.
How Does PITON-Global Differ from Traditional Outsourcing Brokers?
Traditional matchmaking brokers rely on self-reported vendor claims and earn commissions on placement. PITON-Global evaluates candidate providers using proprietary operational benchmarks and real-time performance auditing—occupancy, shrinkage composition, interval adherence, and Effective Hourly Yield—recommends on the buyer’s productive yield rather than provider promotion, and stays engaged through SLA structuring.
How Does PITON-Global’s Network of 100+ Vetted Philippine BPO Providers Benefit Organizations?
A network of more than 100 vetted Philippine BPO partners, each assessed on WFM sophistication, local labor governance, and verified historical productivity, lets CFOs compare providers on the metrics in this article, and on advanced KPI frameworks for BPO performance, rather than on invoice rate. Providers without automated WFM and desktop analytics cannot evidence their numbers and do not reach the shortlist.
How Does PITON-Global’s Advisory-Led Vendor Matching Process Work?
The process runs from operational audit to metrics governance: auditing the buyer’s current occupancy, shrinkage, and adherence data; matching requirements against the vetted network on WFM maturity, domain experience, and verified yield; delivering a shortlist within 48–72 hours; validating real-time reporting infrastructure; then structuring performance-based SLAs around occupancy targets, controllable shrinkage caps, micro-interval adherence, and EHY.
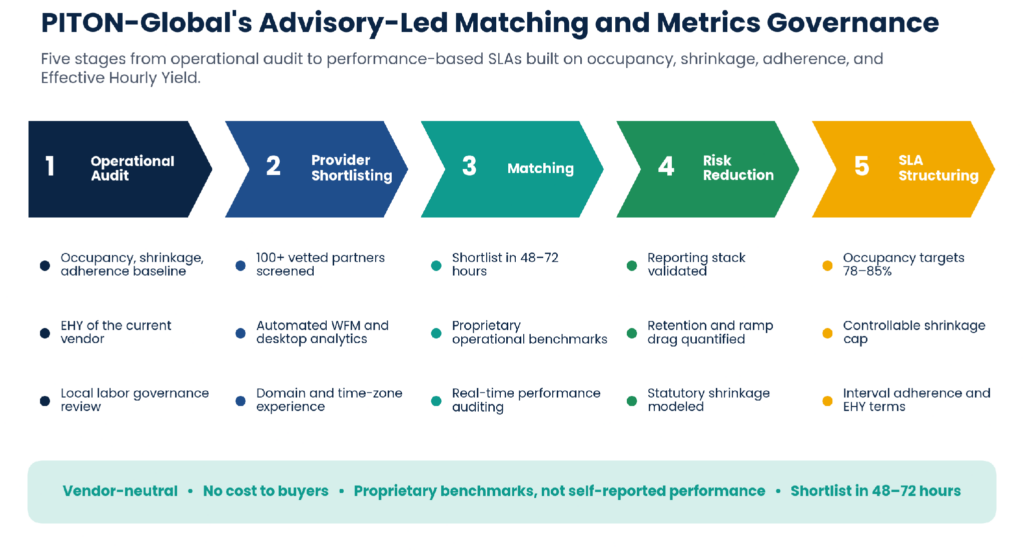
Figure 6. PITON-Global’s advisory-led matching process, from operational audit to performance-based SLA structuring.
Why Do Organizations Use PITON-Global?
Organizations use PITON-Global to eliminate sourcing risk, structure performance-based SLAs, and maximize long-term productive yield rather than chase the lowest bill rate. Because the advisory carries no cost to the buyer, it adds independent auditing at the point where vendor performance reports are least reliable.
Frequently Asked Questions
What is an optimal workforce occupancy rate for BPO operations in the Philippines?
An optimal workforce occupancy rate for contact center and back-office delivery sits in a balanced band: high enough to keep paid time productive, but short of the ceiling. Sustained occupancy near the top leads to agent fatigue and elevated voluntary turnover, while persistently low occupancy indicates unaddressed operational inefficiency.
How should CFOs handle Philippine statutory holidays when modeling contract shrinkage?
Statutory holiday pay, 13th-month pay adjustments, and night differential premiums should be factored into baseline commercial financial models as predictable fixed shrinkage rather than treated as unbudgeted operational overruns.
What is the operational difference between schedule adherence and schedule conformance?
Schedule adherence tracks whether an agent is working assigned tasks at the exact scheduled time intervals. Schedule conformance measures total hours worked relative to total scheduled hours, regardless of whether the timing aligned with planned queue demand.
How does agent turnover degrade workforce utilization metrics?
Agent turnover causes continuous capacity loss. During initial 60-to-90-day onboarding periods, new hires operate well below full handling efficiency, reducing overall program yield and increasing supervisor coaching overhead.
How do modern Philippine BPO providers measure occupancy without micromanagement?
Leading service providers deploy integrated Workforce Management platforms and real-time desktop activity analytics that track active handling time, queue interaction, and transaction speed without manual supervisor logging.
What ratio of supervisors to agents yields the highest productive capacity?
In high-complexity back-office and customer care operations, a 1:12 to 1:15 supervisor-to-agent ratio delivers the ideal balance between real-time performance coaching and operational overhead control.