DATA SCIENCE OUTSOURCING SERVICES PHILIPPINES

An unvalidated model is a wrong decision at scale.

ML modeling, statistical analysis, forecasting and feature engineering — delivered by Philippine-based data scientists who keep your models rigorous and reproducible — because a model’s training score is a promise production has to keep.

Manila, Cebu & Davao delivery SOC 2 / ISO 27001-aligned Validated data accuracy
MODEL PERFORMANCE · HELD-OUT Q2 2026
Fraud-detection F1 — from 71% at engagement start
97%
F1 score
97%
Held-out validation
100%
An unvalidated model is the real expense. Find the team that proves theirs hold up. Get matched
PLATFORMS & STANDARDS
SnowflakePyTorch / TensorFlowscikit-learnMLflowDatabricks / SageMakerISO 27001SOC 2
22Vetted Data
Science Partners
Data scientists measured on model validity, not notebook count.
640+Production Models
Shipped / Year
Modeling, forecasting and feature work across domains.
8Reproducible-Pipeline
Delivery Hubs
ISO 27001-aligned operations with reproducible pipelines.
THE UNVALIDATED MODEL IS THE REAL COST · 2026

With data, an overfit model or an unvalidated feature doesn’t cost you a ticket — it corrupts the forecast, misleads the decision and surfaces as a wrong number in a board report. Data work here is an accuracy function, judged on validation and reproducibility, not models shipped per week.

THE CLIMB · THE ANALYTICS MATURITY CURVE

A dashboard tells you what happened. The money is four steps up the curve, at what to do.

Analytics has a maturity curve, and most organizations are parked at the bottom of it. Each step up is worth more than the one below it — and each step is where more vendors quietly fall off: plenty of teams can chart the past; far fewer can build a churn model that’s still accurate in month six; fewer still can turn that model into a ranked intervention list a retention team actually works Monday morning.

STEP 1 · DESCRIPTIVE
What happened

The dashboard. Where most analytics budgets park — and stay.

STEP 2 · DIAGNOSTIC
Why it happened

The post-mortem. Useful, and permanently backward-facing.

STEP 3 · PREDICTIVE
What will happen

The forecast that holds up out of sample — the rigor gate below is the admission ticket to this step.

STEP 4 · PRESCRIPTIVE
What to do

The recommendation with the reasoning attached. The destination is the decision.

THE BUYER’S TESTAsk a data-science vendor which decision their last model changed, and what the number was before and after. “We shipped forty models” answers a different question — the one nobody asked.
01THE DATA LIFECYCLE ENGINE

Five stages from raw to decision-ready — click where yours leaks.

A failure at any stage compounds quietly downstream until it surfaces as a broken analysis or a bad decision. Select a stage to see the work, the control, and the metric that governs it.

DEFINITION

Data science runs the full model lifecycle — collect and prepare data, engineer features, train, validate on held-out data, and deploy with drift monitoring — under reproducible-pipeline QA, measured by model accuracy and honesty, not models shipped per week. Held-out validation on every shipped model across 2025–26 vetted engagements (DS-080: forecast error −84%).

01
Collect
02
Features
03
Train
04
Validate
05
Deploy
01
Collect
WHAT WE RUN
Training data assembled from your systems, warehouses and events into a versioned dataset — the foundation every model learns from.
CONTROL
Source validation and leakage checks confirm the data is representative and safe to train on.
GOVERNING METRIC
100%
sources validated
John Maczynski
CEO · DATA SCIENCE AUTHORITY

“With models, the pipeline and the decision are the same conversation. An overfit feature doesn’t annoy anyone today — it surfaces months later as a wrong number in a board report. That is why validation and reproducibility, not models shipped per week, are the only metrics that matter here.”

John Maczynski · CEO, PITON-Global · 40-Year Global BPO Veteran
THE LAST MILE · DECISION SCIENCE & EXPERIMENTATION

The model predicts who will churn. Decision science tells you who’s worth saving — and proves the save worked.

Prediction is half the job. The other half is the discipline our decision-science bench runs — and the output isn’t a score; it’s a defensible claim about cause. The difference between “churn fell after we deployed the model” and “the model reduced churn by 3.1 points, and here’s the holdout that proves it.” Boards fund the second sentence.

UPLIFT MODELING
Not “who will churn” but “whose churn our intervention can actually change” — retention budget spent on the persuadable, not burned on the already-lost or the never-leaving.
EXPERIMENTATION
A/B and holdout designs that separate the model’s contribution from the tide — a retention program that “worked” during a market upswing proved nothing.
CAUSAL INFERENCE
Where experiments can’t run: the observational designs that get you an honest effect estimate when you can’t randomize a price change.
02AFTER THE SHIP DATE

A model is not done when it deploys. It’s done when it’s retired — and everything between is MLOps.

Deployment is where most engagements end and where model risk begins. Our MLOps discipline runs the full post-ship lifecycle — the page’s drift monitoring lives here, as one station in a lifecycle rather than a floating claim.

DEPLOYMENT

Versioned, registered, rollback-ready — the model registry as the book of record for what’s serving which decision.

MONITORING

Prediction distributions, input drift, performance against fresh actuals — the dashboard that catches the rot before the board report does.

RETRAINING CADENCE

Triggered by drift thresholds, not calendar habit — and every retrain re-validated on held-out data, because a retrained model is a new model wearing an old name.

RETIREMENT

The model quietly beaten by a simpler baseline gets decommissioned, documented, and replaced — model hoarding is technical debt with a prediction API.

03GOVERNED, EXPLAINABLE, CHALLENGEABLE

A model that influences credit, pricing, or care can’t be a black box — legally in more places every year, and practically everywhere.

Every production model ships with its governance file: explainability (feature attributions a domain owner can read — why this score for this account), bias and fairness auditing (performance sliced across protected and proxy dimensions, documented before ship and re-checked at retrain), EU AI Act alignment where a use case is high-risk, and HIPAA-aligned handling where health data is in scope.

THE PURPOSEThe recommendation must be challengeable. A model your team can’t interrogate is a model your regulator eventually will — and “the vendor built it” has never once worked as an answer.
04A SCRIPT LIBRARY VS. A DATA-SCIENCE TEAM

A script library vs. a data-science team that ships models that hold up.

Seven dimensions, read as risk vs. rigor — what a loose script library exposes versus what a real data-science team safeguards.

Script library
Data-science team
Model Accuracy
Untracked notebooks
Reproducible pipelines
Validation
Untested on held-out data
Cross-validated & tested
Feature Data
Stale, leaky features
Source-validated features
Analysts
Offshore black box
Embedded data partner
Security
Ad-hoc
ISO 27001, audit-ready
Metric
Models shipped per week
Model accuracy & honesty
Coverage
Business-hours
24/7 follow-the-sun
05RADICAL TRANSPARENCY

The model proposes. You decide. And every recommendation ships with the evidence to argue against it.

01
Decisions, strategy, and accountability stay with you — in the SOW.
Our teams frame the question with you, build and validate the models, run the experiments, and surface decision-ready insight; what we never do is make the call or own its consequences. Every model ships explainable and bias-audited precisely so your team can challenge it — a recommendation that can’t be argued with isn’t rigor, it’s abdication with a confidence interval.
02
Analysis-ready data — or an honest week-one conversation about getting there.
Models are only as sound as their inputs; where your pipelines, quality, and governance need work, that’s our Data Operations service, engaged explicitly, not smuggled into a modeling quote. The territory line, stated on-page: DO- owns the pipes and the records; DS- owns what’s learned from them. One handoff, two disciplines, never blurred — and this page speaks only the second vocabulary.
03
Named decision owners are a prerequisite.
A model without a decision owner is a dashboard with extra steps. Every engagement starts by naming which decisions the work serves and who makes them — because “build us some models” is the brief that ends in beautiful notebooks nobody acts on, and we’d rather decline it than bill it.
04
Senior review has a ceiling per pod, and we hold it.
Validation sign-off, bias-audit review, and experiment design don’t survive unlimited span-of-control. Pods cap where the rigor holds.
A shortlist that includes “no” is the only kind worth having.
06THE MATH OF MODELS YOU CAN TRUST

Where does the 6.3× return come from when models hold up in production?

From four streams a per-model rate ignores: forecast-error cost eliminated, bad-decision risk re-routed, uplift-targeted spend efficiency, and data-science labor arbitrage. The most valuable model is the one that ships and holds up in production — and the decision it keeps sound.

Forecast-Error Cost Eliminated
$1.3M – $2.6M
Bad-Decision Risk Priced & Re-Routed
$1.1M – $2.2M
Uplift-Targeted Spend Efficiency & Rework Avoided
$0.9M – $1.8M
Data-Science Labor Arbitrage
$0.9M – $1.8M
TOTAL ANNUAL NET BENEFIT100-SEAT DATA-SCIENCE OPERATION
$3.9M – $7.4M
6.3×
Documented return
01
Model Accuracy — Primary Driver
The global retailer behind DS-080 cut forecast error 84% with a validated ML pipeline — retiring the overfit forecasts that had been corrupting its board reports. Annual rework cost avoided: $2.3M.
02
Integrity — Decisions Protected
Held-out testing and drift monitoring kept model accuracy honest in production, keeping reports and models clean and protecting the decisions that ride on them.
03
Reporting — Compressed
Reporting compresses by days once pipelines run clean and data validates — trustworthy numbers reach decision-makers earlier.
ENTITY PROOF · Q4 2025–Q2 2026
84%
Forecast error reduced
The global retailer behind DS-080 — a decade of sales and inventory data — moved data science to PITON-Global. Total 12-month net benefit: $6.5M against a $980K engagement cost — a 6.3× return.
300+ models/yr · Manila, Cebu & Davao · reproducible pipelines
THE DATA FILE · ENGAGEMENT DS-080Verified Q2 2026 · Manila, Cebu & Davao
CLIENT ENTITY
Global retailer — a decade of sales & inventory data (the client story below) processing 34 models across 120M predictions a year.
PRE-DEPLOYMENT BASELINE
Unvalidated models drifting in production, irreproducible results and predictions no one could trust.
THE INTERVENTION
A reproducible data-science operation across Manila, Cebu & Davao — ML pipelines and model tracking on Snowflake + MLflow.
THE DATASET, MEASURED
97%
Fraud-detection F1 — held-out
from 71% at start
−84%
Forecast error
rework avoided
97%
F1 score
from 71%
−5d
Reporting cycle
faster insight
6.6×total engagement return
$6.5M net benefit on $980K program
Reviewed by John Maczynski (CEO) &
Ralf Ellspermann (CSO) · Q2 2026
CLIENT STORY · ENGAGEMENT DS-080 · GLOBAL RETAILER

How a global retailer turned a decade of data into forecasts it could trust — and trusted its dashboards again.

Demand forecasts ran on spreadsheets and gut feel, and stockouts and overstock kept recurring across legacy systems. Reports contradicted each other, and the board had stopped trusting the numbers in front of it.

94%
forecast
accuracy
100%
held-out
validated
5 days
faster
reporting
THE CHALLENGE

A multinational retailer had a decade of sales and inventory data but no models to act on it. Forecasts were manual, stockouts were constant, and analysts spent days reconciling by hand, and leadership was making decisions on data nobody fully trusted.

WHAT WE SOURCED

We sourced a validated-data-science team across Manila and Cebu running reproducible pipelines, cross-validation and reconciliation against source — working natively inside the retailer’s systems with a complete audit trail, and feeding failure patterns back into the validation rules each week.

THE OUTCOME

A demand-forecasting model reached 94% held-out accuracy, forecast error fell 84%, and the monthly reporting cycle compressed by five days. Years of mismatched numbers ended: the analytics layer reconciled and the board dashboards lined up.

“They gave us a demand model we actually trust — validated on data it had never seen, reproducible, and monitored for drift. It is driving decisions we used to make on gut feel.”

— Head of Data & Analytics, global retailer
FOR THE HEAD OF DATA How many decisions ran on data you couldn’t fully trust last quarter?
07PRICING TOPOGRAPHY · 2026 RATE CARD

Indicative 2026 rates — the modeling roles shown apart from the seat.

CORE ROLERATE (USD/HR)OPERATIONAL PROFILETIER
Data analyst$10–$15Analysis, reporting, ad-hoc investigation.T
BI / visualization developer$12–$17Dashboards, KPI layers, decision-ready reporting.T
Data scientist$15–$26Predictive & statistical modeling, feature engineering.R
ML engineer$17–$28Model development, productionization.R
MLOps engineer$17–$26Deployment, monitoring, drift, registry (the lifecycle).R
Decision scientist$16–$26Uplift, causal inference, experiment design — the defensible claim about cause (the last mile).NO GENERIC
EQUIVALENT
Model-validation & bias auditor$14–$22Held-out validation, leakage checks, fairness audit — the person the governance file belongs to (governance).NO GENERIC
EQUIVALENT
Analytics / DS lead$20–$30Roadmap, delivery governance, decision-owner liaison.LEADERSHIP

The two premium rows have no commodity equivalent because a script library staffs neither: causation goes unproven and models ship on training scores. Rates confirmed per engagement against seniority mix and domain.

08WHO WE SERVE

Four kinds of decision, modeled four different ways.

01Retail & e-commerce

The flagship’s home: demand forecasting, pricing, the dashboards the board trusts again. DS-080 is this decision set, measured.

02Financial services & fintech

Risk and credit scoring, fraud anomaly detection — where the governance file isn’t optional and never was.

03SaaS & subscription

Churn, propensity, expansion — and the uplift layer that spends retention budget on the persuadable.

04Healthcare & life sciences

Capacity forecasting, operations analytics, real-world evidence — HIPAA-aligned throughout, clinical decisions never modeled away from clinicians.

THE MODEL FILE · ENGAGEMENT DS-087 · PRODUCTION-MODEL AUDIT ONLY

Production-model audit only — your models, re-validated on data they’ve never seen. The training scores were not the truth.

CLIENT ENTITY

Enterprise financial services group, 34 models in production, built over 7 years by rotating teams and departed contractors. Identity withheld under NDA.

PRE-DEPLOYMENT BASELINE

The model inventory was a rumor: 34 models serving live decisions, documentation ranging from thorough to a departed contractor’s notebook, and every accuracy figure on file dating from training day. Nobody had re-validated on fresh data since ship; nobody could say which models had drifted, which leaked future information through a careless feature, and which had been quietly beaten by the naive baseline years ago. Decisions were riding on all of them anyway.

THE INTERVENTION

An audit-only engagement — no new models built, read access to registries, pipelines, and decision logs. Every production model re-validated on held-out recent actuals: current performance vs. training-day claims, drift trajectories reconstructed, feature code audited for leakage, and each model benchmarked against the simplest honest baseline. Findings triaged: keep (holding up — documented and monitored going forward), retrain (drifted but sound — re-fit and re-validated), retire (leaking, rotten, or baseline-beaten — decommissioned with the decision routed to a sounder input).

8 WEEKS, MEASURED
METRICBELIEVEDFOUNDWHAT IT WAS
Models holding training-day performance34 of 34 (assumed all)21 of 34The inventory, told the truth about
Leakage findings0 known5Accuracy that was never real
Models beaten by naive baseline0 known9Complexity subsidizing nothing
Decisions re-routed to sound inputs3The wrong numbers, out of the board pack
STRATEGIC INSIGHT

The flagship builds trust forward; DS-087 restores it backward — the client’s own artifacts testifying against their own assumptions, every finding arithmetic. The second row is the sale in one line: a leaking model’s accuracy was never real — the training score was a promise the production data never kept. A head of data doesn’t need a new modeling vendor to justify this engagement; they need one honest quarter of held-out actuals and the willingness to hear what it says. The audit is the model-rigor test above, run against your own shop.

098-WEEK DATA-SCIENCE STAND-UP

A validated data-science operation live in 8 weeks — accuracy proven before scale.

A gated stand-up. No model ships until validation and bias checks are signed off and a parallel run reconciles clean against source.

01
Wk 1–2
Schema & Pipeline Mapping
Connection to Snowflake or your DB, schema and pipeline mapping, validation-rule design, and a baseline audit of accuracy.
02
Wk 3–4
Team & Validation Build
Recruit and train data scientists, configure reproducible pipelines, validation gates and drift monitoring.
03
Wk 5–6
Parallel Run
Run a pilot dataset, daily reconciliation against source, model accuracy validated against the held-out gate before handover.
04
Wk 7–8
Cutover & Govern
Phased volume ramp, live accuracy/validation/drift dashboard, monthly model reviews — PITON-Global Validated-Model certification.
10THE MODEL-RIGOR TEST · WHAT TO VERIFY

Before a vendor touches your data, can they prove the model holds up?

Three controls separate a real data-science team from a script library — and each is demonstrable before you sign. A single wrong record propagates — into a broken analysis and the wrong call built on it.

01
Validation on Every Model
A loose script ships an overfit model. A real operation cross-validates and stress-tests every model on held-out data, so overfitting is caught before it reaches production.
VERIFY: Ask for held-out accuracy, precision and recall — not the training score
02
Drift & Leakage Monitoring
A model that beat the benchmark once quietly rots in production. The teams worth hiring monitor for drift and check features for leakage, so accuracy holds long after launch.
VERIFY: Ask how they detect drift and test for feature leakage
03
Secure & System-Native, Not Email
Data work over email and personal drives leaks and drifts. A validated data-science operation works natively in your systems on ISO 27001 infrastructure with a clean audit trail.
VERIFY: Confirm secured, system-native working, not email
MODEL-RISK ARCHITECTUREHow Each Risk Is Designed Out
Model Validation
Every model is validated on held-out data and independently reviewed — 100% of shipped models pass the held-out gate, catching overfitting before it reaches production.
Reproducible & Monitored
Pipelines are reproducible and versioned, with drift and feature-leakage monitoring, so model performance holds honest across the dataset.
Secure, System-Native
The team works native in your stack on ISO 27001 infrastructure, fully audit-trailed, so nothing drifts and nothing leaks.
Ralf Ellspermann
CSO · DATA SCIENCE

“Give a prospective partner a held-out quarter the model has never seen and ask for accuracy, precision and recall on it — not the training score. A real data-science team reports honestly on them. A script library ships right past them, and three months later a board report is wrong and no one knows why.”

Ralf Ellspermann · CSO, PITON-Global · 25-Year Philippine BPO Veteran
FOR DATA & ANALYTICS LEADERS

A drifting model you can’t see is a decision you’re about to get wrong.

Tell us where your ML strains — model drift, irreproducible pipelines, slow deployment, unreliable predictions — and we’ll hand you 6–10 vetted data providers, each one proven on a held-out validation test before it reaches your shortlist.

Get my data-science shortlist
Vendor-neutral · no cost to you · 24-hour response guarantee, production-model audit estimate included · prepared and presented by John Maczynski, CEO
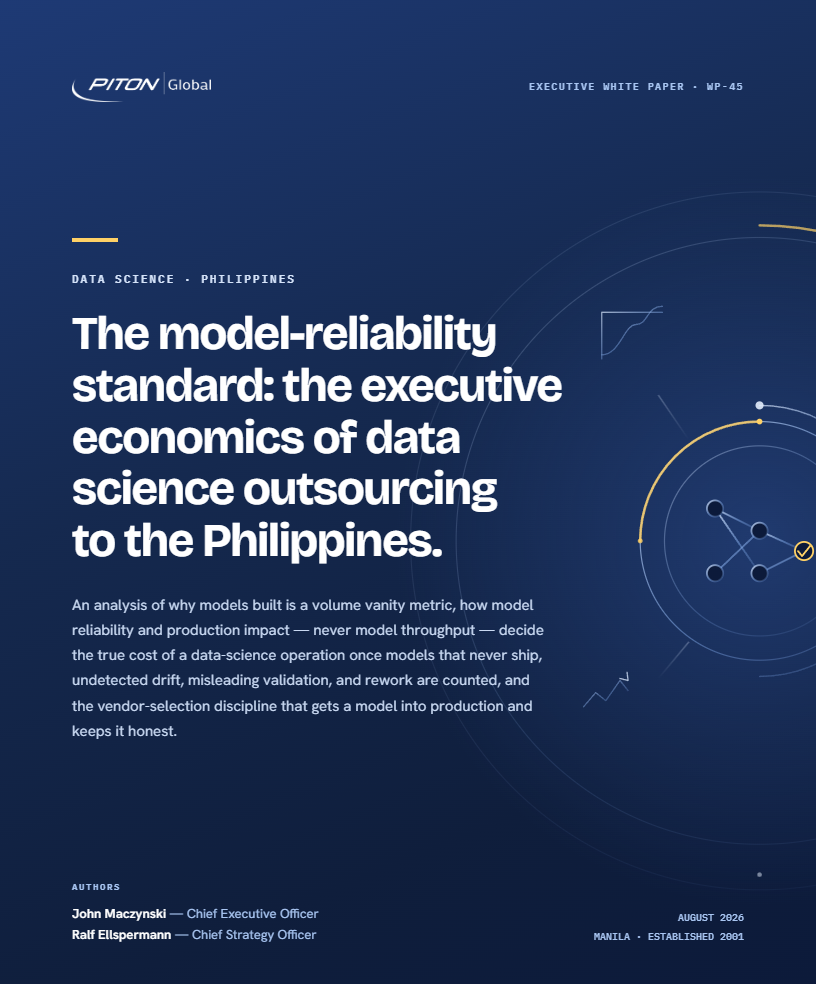
WP-45 Data Science Outsourcing white paper cover
PDF · 14 PAGES
11WHITE PAPER WP-45 · DATA SCIENCE · AUGUST 2026

The model-reliability standard: the economics of data science outsourcing.

Why models built is a volume vanity metric, how model reliability and production impact — never model throughput — decide the true cost of a data-science operation once models that never ship, undetected drift, misleading validation and rework are counted, and the vendor-selection discipline that gets a model into production and keeps it honest. Part of PITON-Global’s Executive White Paper Series, by John Maczynski and Ralf Ellspermann.

14 pages8-min readMaczynski & Ellspermann
IN THESE PAGES
The data-science contract — validate it honestly, ship it to production, monitor it for drift — that separates a data-science team from a model factory.
The models-built-vs-production-reliable model and the economics of a model that never leaves the notebook.
Engagement DZ-059: the 40-seat data-science rebuild behind a 6.2× first-year return, 88%+ deployment, and drift cut by two-thirds.
Read the white paper (PDF) Open access · published August 2026
13ANSWERED BY OUR PRINCIPALS

What data and ML leaders ask before they outsource data science.

From the principals directly: thorough answers to the questions that make or break a data-science engagement.

How do you validate models and monitor for drift?+
Every model passes cross-validation plus held-out testing and bias validation against reference data. That keeps model accuracy honest, not overfit, in production — catching data drift and leakage before they quietly degrade a model in production and quietly distort a report months later.— Ralf Ellspermann, CSO
What does outsourcing data work actually save us?+
Typically 50 to 70 percent on cost per model versus onshore, with faster turnaround. The larger saving is avoided downstream damage: held-out validation prevents the corrupted forecasts, misfired campaigns and bad decisions that unvalidated models cause long after they ship.— John Maczynski, CEO
Can the team scale for a migration, a backlog or seasonal demand?+
Yes. The bench grows for the project and shrinks with it — what you pay for is throughput, not permanent headcount. The same reproducible-pipeline validation and monitoring controls apply whether it is one model or forty.— Ralf Ellspermann, CSO
How is our data protected while you work on it?+
Delivery stays on ISO 27001 infrastructure behind access controls, storing nothing locally and logging everything. Every operator sees only their project, every action is logged, and the data remains protected within the secured environment throughout.— Ralf Ellspermann, CSO
Will you work inside our systems or hand back files?+
Your systems are the workspace (CRM, ERP, DB, BI, Snowflake), audit trail included; spreadsheets over email are not how this works. The two data layers cannot drift apart, and every record retains a traceable, clean lineage.— John Maczynski, CEO
Can you deploy models into production and support MLOps?+
Anything that fails a rule is flagged for SME review and resolved against the rule set, not silently posted or guessed at. We mine our own failures: patterns route back into the validation rules until the recurring issues stop recurring.— John Maczynski, CEO
Which machine learning frameworks and model types do you support?+
The full lifecycle — capture and entry, cleansing and de-duplication, enrichment and structuring, migration and transformation, ongoing data management, and analytics and reporting support. Input variety is expected: structured and unstructured data across documents, forms, scans, surveys and live feeds.— Ralf Ellspermann, CSO
Which data work should we outsource first?+
Begin with high-volume, rules-based work — entry, cleansing and reconciliation — where validation delivers the clearest, fastest accuracy gains. The advanced layers — enrichment, transformation, analytics — arrive after the foundation has proven the rules and the bar.— John Maczynski, CEO
Are you tied to particular tools or platforms?+
No. We work natively in your existing stack and stay vendor-neutral on tooling. We study your stack, data and goals, propose the right-fit provider and approach without charge, and the final choice never leaves your hands.— Ralf Ellspermann, CSO
How do you measure performance so we can trust the output?+
Against model accuracy, precision and recall, drift and time-to-deploy, surfaced in a live dashboard with monthly reviews. We deliberately never report models shipped per week — raw speed without validation produces volume you cannot trust, which defeats the entire purpose.— Ralf Ellspermann, CSO
Authorship, Review & Benchmark Verification
Authored by:
Ralf Ellspermann
Ralf Ellspermann
Chief Strategy Officer of PITON-Global
Two Decades Building and Advising Award-Winning Philippine BPO Operations

Ralf audits data-science floors on reproducibility and pipeline discipline across the Philippine vendor pool.

View full bio  →
Verified by:
John Maczynski
John Maczynski
CEO of PITON-Global
Former Global EVP of the World’s Largest Contact Center · Four Decades of Outsourcing Experience

John reviews the team economics and commercial terms behind each data-science program on this page.

View full bio  →
Last Reviewed & VerifiedJuly 22, 2026

Re-audited as SOC 2 Type II and ISO 27001 obligations evolve. Every benchmark on this page is held to PITON-Global’s internal vetting standard.

error: Content is protected !!
Inquire Now