

On this page
- Key Takeaways
- What Fully Loaded Cost Metrics Must CFOs Compare When Modeling Philippine BPO Financials?
- What Indirect Financial Drivers Expand ROI Beyond Basic Labor Savings?
- How Should Financial Leaders Structure Implementation Costs to Prevent ROI Dilution?
- What Does a Successful Philippine BPO ROI Outcome Look Like?
- How Does PITON-Global Help CFOs Optimize BPO Financial Outcomes?
- Frequently Asked Questions
CFOs calculate true ROI for Philippine BPO outsourcing by modeling net financial impact: direct fully loaded labor savings plus indirect productivity gains and avoided capital expenditure, minus transition and governance costs, divided by total implementation investment. The savings line starts with a per-agent rate, and how the offshore savings are calculated from that rate for a given function, headcount, and coverage window is the first input to get right. Accurate models also adjust for ramp-up productivity curves, attrition liabilities, tax-incentive structures, and exchange-rate exposure.
Key Takeaways
- Financial formula: Total BPO ROI = (Direct Labor Savings + Efficiency Gains + Overhead Avoidance − Transition Costs − Ongoing Governance Costs) ÷ Total Implementation Investment.
- Direct arbitrage: Fully loaded hourly agent costs in the Philippines run at a fraction of the domestic equivalent for both voice CX and back-office tasks, with back-office work priced below voice.
- Avoided capital expenditure: Offloading infrastructure converts physical facilities, server hardware, and technology licensing from CapEx into predictable OpEx.
- Risk adjustments: Robust models account for vendor governance, ramp-up productivity curves, and exchange-rate movements to protect net returns.
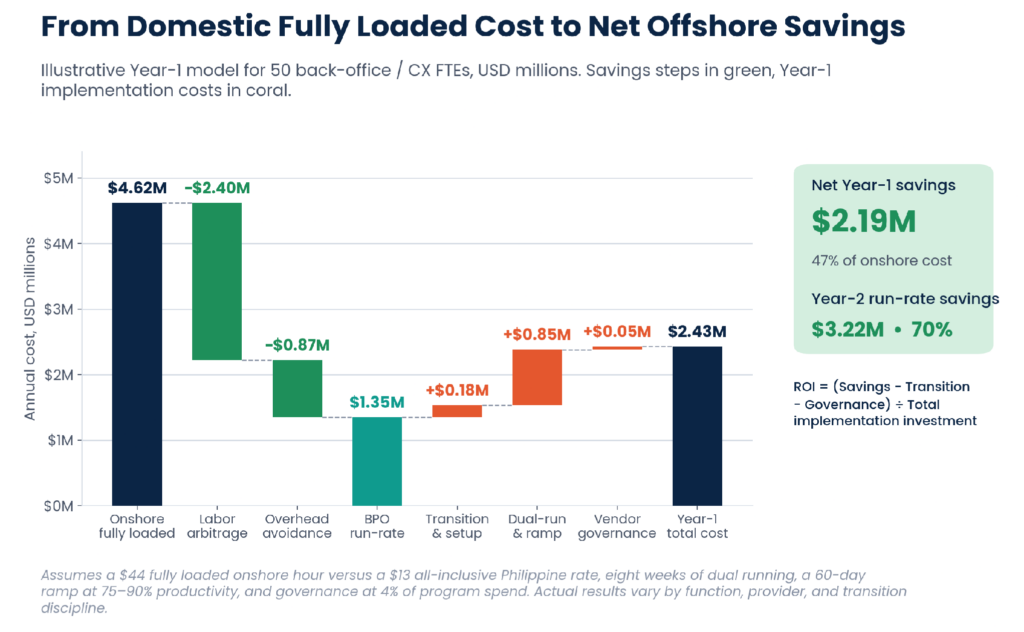
Figure 1. From domestic fully loaded cost to net offshore savings: an illustrative Year-1 model for 50 FTEs after transition, dual-running, and governance costs.
What Fully Loaded Cost Metrics Must CFOs Compare When Modeling Philippine BPO Financials?
CFOs must compare fully loaded onshore costs—salary plus payroll taxes, healthcare, retirement contributions, office space, hardware, software licensing, and talent acquisition—against the all-inclusive Philippine vendor rate that bundles infrastructure, supervision, IT support, compliance, PEZA facility costs, and local benefits. On that basis, customer support, back-office, and finance functions show the deepest direct savings, a pattern our review of the financial benefits enterprises realize offshore documents function by function.
The most common modeling error is comparing onshore base salaries directly with offshore billing rates. Onshore personnel expenses encompass payroll taxes, healthcare contributions, 401(k) matches, office leases, hardware provisioning, enterprise software licensing, and talent acquisition, which together add substantially to base pay once facilities and technology are included. Philippine BPO billing rates bundle every one of those components into a single all-inclusive hourly fee covering operational infrastructure, supervisory personnel, IT support, compliance oversight, PEZA facility costs, and local statutory benefits. The table below sets out the like-for-like comparison and the modeling impact of each line.

Figure 2. Fully loaded cost components onshore versus the all-inclusive Philippine BPO rate, with the CFO modeling impact of each line.
Three effects follow. Direct arbitrage: structural wage differences deliver immediate, durable operating-expenditure reductions. Offloaded overhead: real estate liabilities, power, redundant fiber connectivity, and security compliance shift entirely to the provider, so a 50-FTE program avoids the workstation CapEx and the recurring facilities bill altogether. Variable scale: capacity flexes with business volumes, avoiding domestic recruitment and severance. The chart below compares total annual operating cost for 50 FTEs across three delivery models; a captive center captures much of the wage arbitrage but carries fixed overhead and upfront capital that a BPO partnership converts into OpEx.
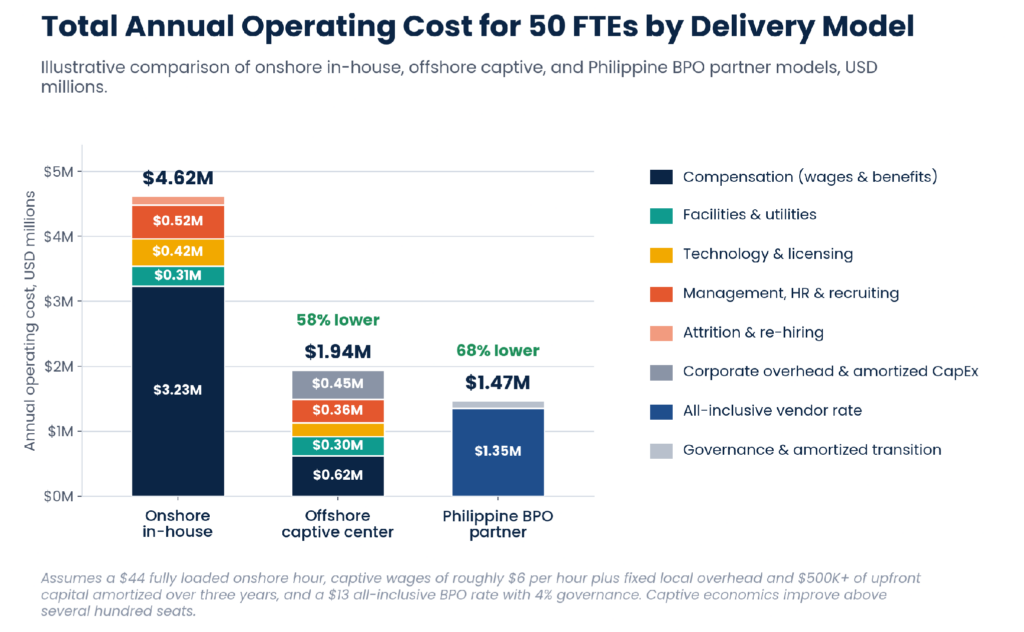
Figure 3. Illustrative total annual operating cost for 50 FTEs: onshore in-house, offshore captive, and Philippine BPO partner.
What Indirect Financial Drivers Expand ROI Beyond Basic Labor Savings?
Mature Philippine BPO operations generate secondary multipliers that materially raise returns: process standardization and AI agent-assist tools lift operational productivity, lower attrition removes the recruiting and training cost of every avoided replacement, and higher First Contact Resolution protects customer retention and lifetime value. CFO models that stop at bill rates capture only half the ledger.
Beyond direct cost reduction, the path from a domestic legacy baseline to standardized BPO workflows and then to AI-assisted operations compounds value at each step: a high fixed cost base gives way to a measurable efficiency gain from documented processes and continuous quality assurance, and then to a larger throughput boost when agents are equipped with real-time AI tools. Three drivers deserve explicit lines in the model.
Process Efficiency and AI Integration
Modern Philippine centers combine university-educated talent with AI agent-assist tools, automated after-contact work, and exception-handling software, driving a further step up in operational productivity. In per-FTE pricing models that gain accrues to the provider unless productivity targets or transaction-based pricing are written into the contract, so CFOs should model it as negotiable value rather than assume it. How that tooling is wired into the client’s own systems is the subject of our guide to technology integration in outsourcing relationships.
Attrition Expense Mitigation
Domestic contact centers often suffer high annual attrition, and every replacement agent carries recruiting, training, and lost-productivity cost. For a 50-seat program that adds up to a material recurring line each year. Premier Philippine BPOs maintain lower turnover through clear career structures and absorb recruiting and training within their rate, insulating clients from re-hiring expense.
Revenue Preservation
Higher customer retention and improved First Contact Resolution directly support customer lifetime value and top-line earnings. A one-point improvement in retention on a large revenue base is worth more in retained revenue than a typical program’s annual governance budget—which is why revenue effects belong in the ROI model even when they are estimated conservatively.
CFOs who evaluate Philippine BPO partnerships solely on hourly bill rates are missing half the financial ledger. The real ROI expansion happens when you account for avoided capital investments, lower attrition liabilities, and the efficiency gains of operating within a specialized delivery center equipped with real-time AI tools.
— John Maczynski, CEO, PITON-Global
How Should Financial Leaders Structure Implementation Costs to Prevent ROI Dilution?
Net ROI requires factoring transition expenses into the model: one-time setup costs for knowledge transfer, dual-running, legal review, and systems integration; a 30–60 day learning curve at reduced productivity; and ongoing vendor governance as a standing share of program spend. Modeled correctly, first-year net savings land well below the steady-state figure and rise from Year 2 once transition costs are absorbed.
Overlooking ramp-up friction or vendor governance is the fastest way to distort initial savings projections. The cash-flow curve below shows the typical shape of a 50-FTE program: an investment trough during migration setup and parallel running, a stabilization phase as productivity climbs, and a steady-state phase in which optimization lifts savings further. Break-even on transition costs typically arrives around month four.
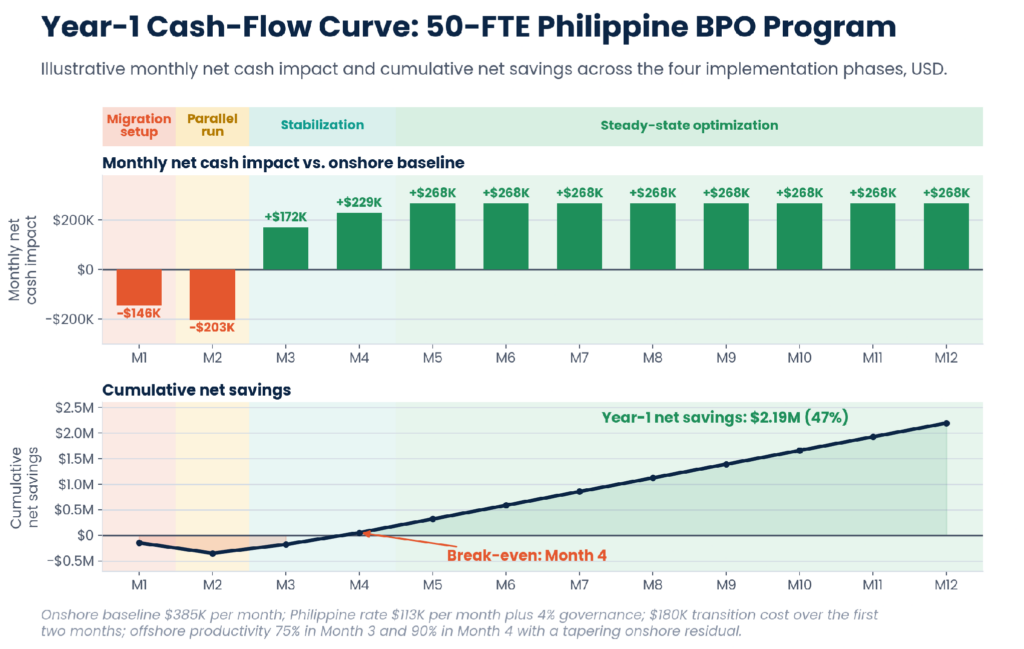
Figure 4. Illustrative Year-1 cash-flow curve across migration setup, parallel run, stabilization, and steady-state optimization for a 50-FTE program.
Quantify One-Time Transition Costs
Budget for initial setup expenses, including knowledge transfer, dual-running operations during migration, legal and contract reviews, and systems integration. For mid-market programs these typically total one to two months of steady-state program cost, and the parallel-run period—when onshore and offshore teams both carry cost—is usually the single largest item.
Account for the Learning Curve
Model agent productivity during the initial 30 to 60 days below steady-state baseline performance before full proficiency is reached. Applying a productivity factor to the offshore team, and a tapering residual to the onshore team, produces a realistic month-by-month savings curve rather than a step change on go-live.
Budget for Vendor Governance
Allocate a fixed share of program spend for ongoing contract management, quality audits, and operational oversight to ensure service delivery matches contract terms. Governance is a permanent line, not a transition cost, and it should be deducted in every year’s ROI calculation rather than in Year 1 alone.
What Does a Successful Philippine BPO ROI Outcome Look Like?
A successful outcome pairs a specialized, right-sized provider with automated exception handling and executive-level focus. One North American logistics platform migrated 40 back-office FTEs to Manila, cut annual operating expenses by roughly two-thirds, recouped its transition investment in under four months, and delivered a net first-year ROI several times the size of that investment.
Client Challenge
A North American freight logistics platform was experiencing eroding operating margins due to high domestic back-office support costs on a fully loaded hourly basis, compounded by rising invoice-processing error rates that generated rework and carrier disputes.
Vendor Selection
The company engaged PITON-Global to run an advisory-led evaluation. PITON-Global benchmarked the firm’s fully loaded baseline, compliance requirements, and growth plan against its vetted network and identified a mid-sized, highly specialized BPO partner in Manila with dedicated logistics experience—one for which the program would receive executive-level focus.
Solution Implemented
The provider migrated 40 back-office FTEs covering freight audit, billing, and carrier support, integrated with automated exception-handling software so that agents concentrated on judgment-intensive cases while routine transactions flowed straight through.

Figure 5. Quantifiable financial outcomes of the logistics back-office migration.
Outcomes and Lessons
The program cut net operational cost by roughly two-thirds within 120 days; the total transition investment was recouped in under four months; and first-year net ROI ran to several times that investment after accounting for all migration and management costs. The lesson: partnering with a specialized provider where the program received executive-level focus prevented operational drag and accelerated time-to-value, and integrating automation at migration rather than after it meant the efficiency gains were captured in the first year’s numbers rather than deferred.
How Does PITON-Global Help CFOs Optimize BPO Financial Outcomes?
PITON-Global is an independent BPO advisory firm headquartered in Manila, led by senior operators with over 65 years of combined global outsourcing leadership. It matches mid-market and enterprise buyers with a shortlist of pre-vetted, top-performing Philippine providers within 48–72 hours at no cost, and brings operational experience to contract negotiation to secure competitive pricing and eliminate hidden clauses.
Who Is PITON-Global?
PITON-Global is an independent BPO advisory firm headquartered in Manila, Philippines, led by senior operators with over 65 years of combined global outsourcing leadership. The company acts as an insider partner for mid-market and enterprise leadership teams navigating the competitive landscape of more than 1,000 Philippine BPO operators, bringing operator-level expertise to provider selection, contract structuring, and financial modeling.
How Does PITON-Global Differ from Traditional Outsourcing Brokers?
Traditional brokers earn transactional referral fees and volume incentives, which biases recommendations toward the providers that pay most. PITON-Global operates as an objective advisory partner: it evaluates providers independently, recommends on the basis of a buyer’s financial parameters, operational requirements, and compliance standards rather than provider promotion, and stays engaged through negotiation and transition.
How Does PITON-Global’s Network of 100+ Vetted Philippine BPO Providers Benefit Organizations?
Access to more than 100 pre-vetted providers—spanning customer experience, back-office, finance and accounting, logistics, healthcare, technical support, and the engineering design work covered in our guide to CAD outsourcing for architecture, engineering, and manufacturing, across Metro Manila, Cebu, and provincial hubs—lets CFOs skip months of discovery and RFP administration. Each provider has already been assessed for pricing competitiveness, certifications, financial stability, and attrition performance, so the shortlist is built on verified data rather than sales collateral.
How Does PITON-Global’s Advisory-Led Vendor Matching Process Work?
The process runs from financial needs assessment to selection support: establishing the fully loaded baseline, volumes, compliance obligations, and growth projections; filtering the vetted network for specialization and right-sized capacity; delivering a curated shortlist within 48–72 hours with benchmarked pricing; verifying security, business continuity, attrition history, and hidden contract clauses; then supporting negotiation, SLA and escalator structuring, and transition oversight.
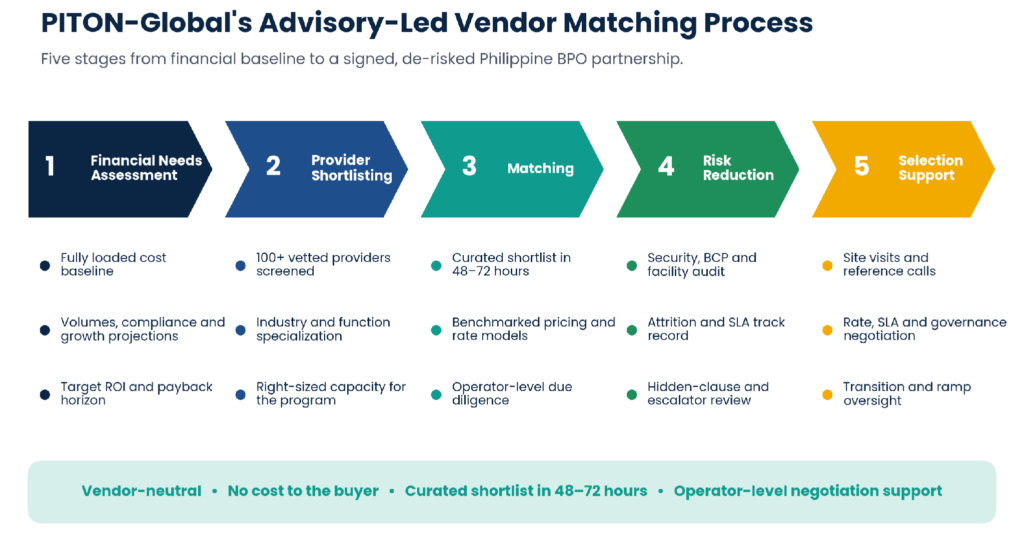
Figure 6. PITON-Global’s five-stage advisory-led matching process, from financial baseline to signed contract.
Why Do Organizations Use PITON-Global?
Organizations use PITON-Global to compress vendor selection from months to days, avoid the hidden clauses and mispriced scope that dilute ROI, and partner with providers that treat the program as strategic. Because the service is provided at no cost to the buyer, it functions as a free layer of financial and operational due diligence at the point where modeling errors are most expensive.
Frequently Asked Questions
What is the typical payback period for a Philippine BPO transition?
Most enterprise programs achieve full payback on transition and setup costs within 3 to 6 months of reaching steady-state operations; well-run mid-market programs, like the logistics case above, can recoup transition investment in under four months.
How do CFOs model currency exchange risk in Philippine BPO contracts?
Most Philippine BPO contracts for international clients are priced and billed in USD, AUD, or GBP, placing foreign-exchange risk management on the provider. CFOs should still model annual escalator clauses and negotiate caps at signing.
What financial impact does the Philippine CREATE MORE Act have on BPO costs?
The CREATE MORE Act provides tax incentives, duty exemptions, and streamlined operational provisions—including clarified work-from-home rules—for PEZA-registered BPO facilities, keeping vendor rates globally competitive and supporting rate stability over multi-year contracts.
How do initial transition costs affect first-year ROI calculations?
First-year models typically reflect reduced net financial savings due to initial setup, dual-running, and ramp-up costs, with the full run-rate saving arriving in Year 2 and beyond once transition costs are fully absorbed.
Should companies build a captive offshore center or partner with a BPO?
A captive facility requires significant upfront capital, legal-entity and regulatory setup, and permanent local management overhead, whereas partnering with a BPO converts expenses entirely into OpEx with immediate operational scale. Captives generally outperform on cost only above several hundred seats.