

On this page
- Key Takeaways
- What Financial Metrics Provide the True Unit-Economics of Outsourcing?
- Which Operational Governance Metrics Prevent Margin Leakage?
- How Does Agentic AI Impact the Cost-Performance Equation?
- What Does Restructuring Back-Office Cost Efficiency Look Like in Practice?
- Why Do CFOs Partner with PITON-Global for BPO Sourcing and Advisory?
- Frequently Asked Questions
CFOs evaluating outsourcing performance must track Cost per Interaction, Fully Loaded Cost per Productive Hour, First-Contact Resolution cost impact, Vendor-Induced Error Rate, and Shrinkage Variance. Combining financial metrics with operational quality metrics ensures that deep cost reductions do not compromise service delivery, customer retention, or compliance—and that paid offshore hours translate into logged-in productive capacity. Those numbers then feed how an offshore team’s numbers are governed month to month.
Key Takeaways
- Beyond hourly seat rates: Evaluating outsourcing performance solely on hourly rates masks hidden costs such as rework, excessive shrinkage, and management overhead.
- Cost per Interaction precision and error-adjusted multipliers: Tracking CPI across channels isolates true unit economics and measures real efficiency gains over time, while monitoring rework rates protects bottom-line savings from the downstream cost of unresolved errors.
- Variance and shrinkage auditing: Auditing shrinkage against an agreed benchmark and tracking schedule adherence prevents paying for unrendered offshore labor hours.
- Advisory-led vendor matching: Specialized BPO sourcing partners eliminate procurement friction and ensure long-term contract governance.
What Financial Metrics Provide the True Unit-Economics of Outsourcing?
True unit economics come from four metrics: fully loaded seat rate; cost per resolved interaction; rework and error expense as a share of spend; and shrinkage variance, each compared between a domestic in-house baseline and a Philippine delivery target. Fully loaded cost per productive hour divides invoiced expense plus retained governance overhead by paid shifts × (1 − shrinkage) × adherence.
Focusing exclusively on hourly labor rates creates a false sense of cost efficiency. To assess true financial return, chief financial officers must evaluate unit-level delivery metrics that capture total operational yield. The anchor metric is Fully Loaded Cost per Productive Hour: total invoiced BPO expense plus retained internal governance overhead, divided by paid shifts multiplied by (1 − shrinkage) and by schedule adherence. Tracking Cost per Interaction across specialized channels then gives an accurate picture of unit economics, as the table below shows.

Figure 1. Unit-economics metrics for a domestic in-house baseline versus a Philippine BPO target benchmark, with the CFO financial impact of each.
Quantifying these unit costs allows finance leadership to confirm whether offshore labor arbitrage translates into net operational savings. The comparison below applies the formula to a domestic and a Philippine cost structure and exposes the hidden layers—governance, rework, and unrendered hours—that a seat rate never shows.

Figure 2. Domestic versus Philippine BPO fully loaded cost per productive hour, highlighting hidden governance, rework, and unrendered-hour expenses (illustrative).
Which Operational Governance Metrics Prevent Margin Leakage?
Three governance metrics protect savings from oversight and rework: high schedule adherence and tightly controlled total shrinkage, where deviations signal unbilled idle time or understaffed queues; First-Contact Resolution yield, because every failed interaction requires a repeat contact that doubles or triples the unit cost; and vendor-induced error rate, since input errors in claims work trigger penalties, churn, and fines.
Operating cost reductions disappear if an offshore team requires extensive domestic management oversight or generates high transaction rework volumes. CFOs must evaluate three operational governance metrics to ensure vendor accountability, a focused subset of the advanced KPI frameworks used in BPO evaluation.
Schedule Adherence and Shrinkage Variance
WFM teams should hold schedule adherence high and keep total shrinkage within the agreed allowance. Deviations indicate unbilled idle time or understaffed queues, and both show up in the productive-hour denominator of the cost formula, alongside the occupancy and utilization measures CFOs rely on.
First-Contact Resolution Financial Yield
Every failed interaction requires a repeat contact, effectively doubling or tripling the unit cost of that transaction. The chart below shows how incremental FCR improvements lower total monthly operating expenditure for the same case volume.
Vendor-Induced Error Rate
In back-office processing such as revenue cycle management or claims processing, input errors trigger financial penalties, customer churn, or regulatory compliance fines. A vendor-induced error rate is therefore a cost line, and it belongs in the monthly review beside the invoice.
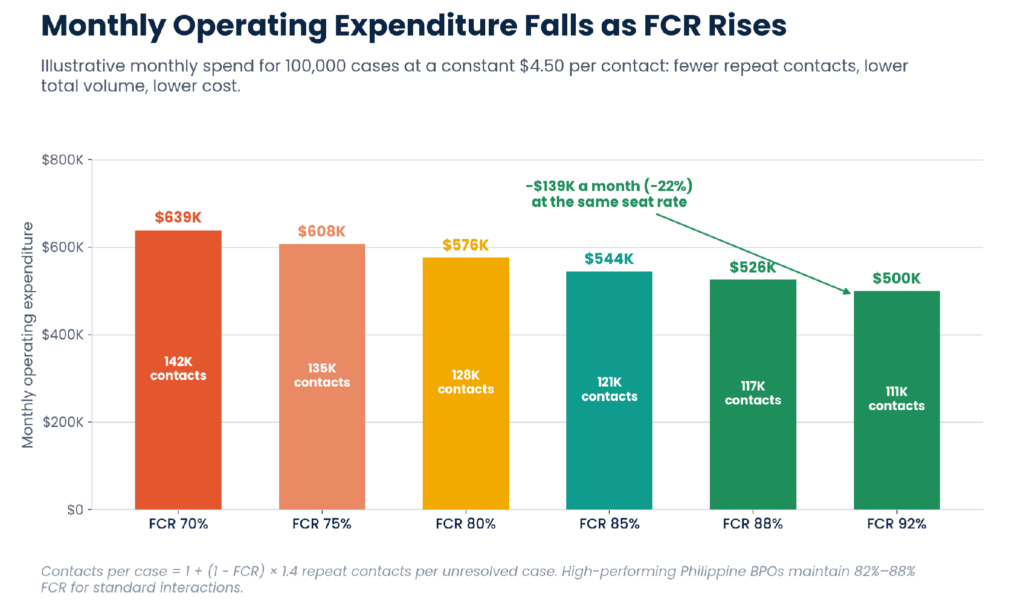
Figure 3. How incremental increases in First-Contact Resolution lower overall monthly operating expenditure for a constant case volume (illustrative).
How Does Agentic AI Impact the Cost-Performance Equation?
Agentic AI—real-time digital assistants working alongside human specialists—has altered traditional BPO cost structures. AI copilots handle administrative work rather than replacing agents: automated after-call summaries eliminate 45 to 90 seconds of CRM logging per contact and lift daily transaction capacity noticeably, compliance guardrails screen every interaction, and higher capacity per agent shrinks the FTE footprint needed for growing volumes.
Rather than replacing human agents, AI copilots handle administrative tasks, allowing human specialists to resolve complex inquiries faster. The AI cost-efficiency ratio captures the effect: total processed transactions divided by total BPO invoiced expense plus AI licensing costs. Three mechanisms drive it.
Automated After-Call Work
AI summaries eliminate 45 to 90 seconds of manual CRM logging per contact, increasing daily agent transaction capacity materially without lengthening the shift.
Real-Time Compliance Guardrails
Automated speech and text monitoring screens every interaction for compliance risks, reducing legal and regulatory exposure that sampling-based quality assurance can only estimate.
Lower Unit Costs
Higher handling capacity per agent reduces the overall FTE footprint needed to support growing transaction volumes, which is where the ratio turns into savings on the invoice.
A CFO who evaluates an offshore provider based solely on low hourly rates is taking on hidden financial risk. Real cost efficiency comes from process yield—combining high schedule adherence, low rework rates, and AI-assisted workflows. When you pair the empathy and discipline of the Filipino workforce with real-time AI tools, you secure durable, deep cost reductions without sacrificing execution quality.
— John Maczynski, CEO, PITON-Global

Figure 4. Workflow efficiency of a hybrid Pilot and Wingman AI-human interaction, with the cost-performance effects and the AI cost-efficiency ratio.
What Does Restructuring Back-Office Cost Efficiency Look Like in Practice?
Restructuring back-office cost efficiency starts with unit-level metrics. A North American financial services firm with high cost per contact and elevated error rates transitioned a 60-FTE back-office and support team to Manila with adherence tracking and AI assistance, cutting CPI steeply within 120 days, reducing errors sharply, delivering substantial annual savings, and lifting NPS 14 points.
Client Challenge
A North American financial services firm experienced rising customer service expenses, with cost per contact climbing steadily and transaction error rates well above acceptable levels. Internal governance costs grew as managers spent significant time correcting back-office processing errors.
Vendor Selection
The enterprise partnered with PITON-Global to audit its delivery model. PITON-Global evaluated program specifications against its network of more than 100 vetted Philippine BPO providers, shortlisting three mid-market operators with SOC 2 compliance, financial services experience, and automated WFM systems.
Solution Implemented
The client transitioned a 60-FTE back-office and support team to Manila. The provider introduced automated real-time adherence tracking and AI-driven workflow assistance, with cost per interaction, error rate, and shrinkage reported to the client’s finance team monthly.

Figure 5. Quantifiable outcomes of the financial services firm’s back-office restructuring.
Outcomes and Lessons
Cost per interaction fell steeply within 120 days. Standardized quality assurance auditing brought error rates down sharply and cut claim reprocessing expense; net annual cost savings were substantial while coverage expanded to 24/7; and improved FCR and faster resolution lifted Net Promoter Score by 14 points. The key lesson: tracking unit-level operational metrics allows financial executives to achieve cost reductions while raising service delivery standards.
Why Do CFOs Partner with PITON-Global for BPO Sourcing and Advisory?
Navigating more than 1,000 BPO operators in the Philippines introduces operational and financial risk, and pitch decks obscure true shrinkage, turnover, and hidden management costs. PITON-Global, an independent sourcing advisory led by CEO John Maczynski and CSO Ralf Ellspermann, evaluates candidates against real performance data across more than 100 vetted providers, shortening procurement to 48–72 hours and securing favorable terms.
Who Is PITON-Global?
PITON-Global is an independent BPO sourcing advisory firm headquartered in Manila. Led by CEO John Maczynski and Founder and CSO Ralf Ellspermann, who bring over 65 combined years of global BPO executive experience, the firm provides buyer-side advisory services grounded in hands-on operational leadership.
How Does PITON-Global Differ from Traditional Outsourcing Brokers?
Brokers and pitch decks trade on headline rates; the shrinkage, turnover, and management costs that decide the CFO’s unit economics are rarely disclosed. PITON-Global evaluates candidate BPOs against real performance data—adherence, shrinkage, FCR, error rates, attrition—recommends on the buyer’s cost per productive hour rather than provider promotion, and stays engaged through contract governance.
How Does PITON-Global’s Network of 100+ Vetted Philippine BPO Providers Benefit Organizations?
A network of more than 100 vetted Philippine providers with performance data on file is what turns 1,000-plus operators into six to ten vetted candidates and one matched partner. Because each provider’s shrinkage, attrition, WFM systems, and compliance posture are already verified, the CFO’s metrics can be written into the agreement rather than requested after signature.
How Does PITON-Global’s Advisory-Led Vendor Matching Process Work?
The process runs from delivery-model audit to contract governance: establishing the buyer’s current cost per interaction, error rate, and governance overhead; matching program specifications against the vetted network on compliance, domain experience, and automated WFM; delivering six to ten vetted candidates and a shortlist within 48–72 hours; verifying performance data on site; then securing favorable commercial terms with shrinkage allowances, training hours, and reporting access defined.
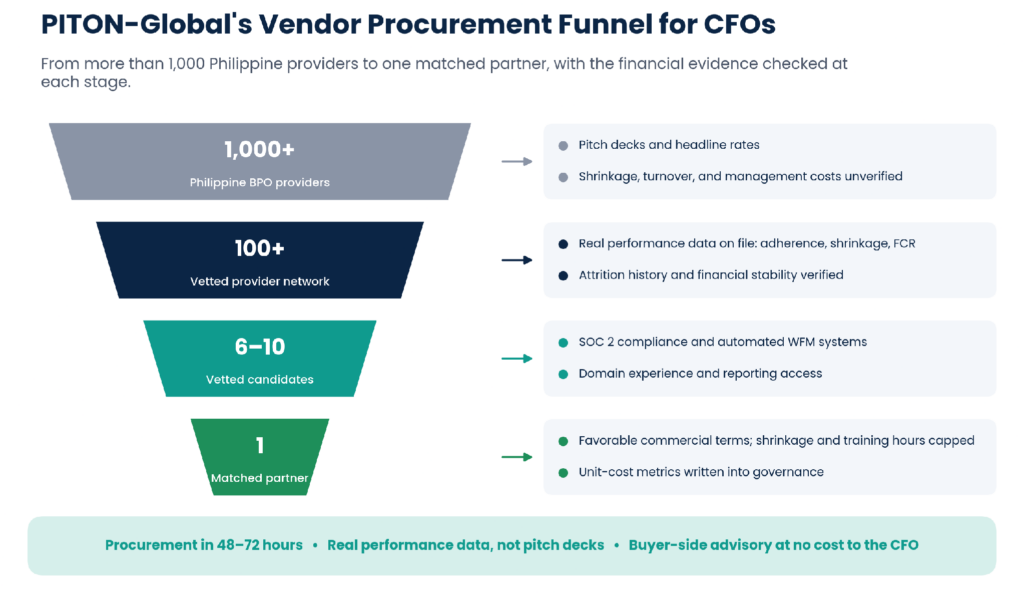
Figure 6. PITON-Global’s vendor procurement funnel for CFOs: from more than 1,000 Philippine providers to one matched partner, with the financial evidence checked at each stage.
Why Do Organizations Use PITON-Global?
CFOs partner with PITON-Global to eliminate selection risk, shorten procurement timelines to 48–72 hours, and secure favorable commercial terms. Because the advisory carries no cost to the buyer, it puts an operator’s reading of the metrics in this article on the buyer’s side of the table.
Frequently Asked Questions
What baseline cost savings should a CFO model when outsourcing to the Philippines?
Enterprises typically realize deep fully loaded cost savings compared with domestic onshore equivalents, with the size of the gap depending on specialized skill requirements and technology integration.
How can financial leaders prevent hidden costs in offshore BPO contracts?
CFOs should establish clear contractual terms regarding shrinkage allowances, currency adjustments, telecommunication pass-through fees, and training hours to ensure baseline invoice predictability.
What is a target First-Contact Resolution benchmark for Philippine BPO teams?
High-performing Philippine BPOs maintain consistently high FCR rates for standard interactions, significantly reducing repeat contact volume and total operating costs.
How do BPO providers report real-time operational metrics to client CFOs?
Top-tier operators provide direct access to centralized WFM dashboards, automated reporting suites, and daily operational telemetry covering adherence, handling times, and quality scores, the same core KPIs for evaluating outsourced services any buyer should see.
How does workforce attrition affect the financial yield of an outsourcing program?
High attrition increases training overhead and temporarily reduces team efficiency. Partnering with BPOs that keep attrition well below the industry average preserves program momentum and protects unit economics.